A One-Bid Recompete Is the Best News on Your Board
450 of the 1,219 contracts on our expiring board reached the incumbent without a second bidder. Only 130 of them were ever open to one, and that minority is the only part of the single-bid pile that belongs in a capture decision.
450 of the contracts on our expiring board reached their incumbent without a second bidder.
That is 36.9% of the 1,219 live rows, carrying $261.15B in obligations, and some version of it is in every capture deck in this industry.
As written, it tells you nothing.
We refreshed the expiration pipeline this morning, then made one award-detail call per live row, 1,219 for 1,219, to pull the field that sits beside the offers count: how the agency competed the work before anyone counted bids. Together the two fields answer a question the offers count alone cannot.
"Did nobody bid, or was nobody allowed to?"
Two Roads to One Bid
The 450 split cleanly, with nothing left over:
- 320 rows (71.1%), $236.46B are coded
NOT COMPETEDorNOT AVAILABLE FOR COMPETITION, each with a FAR 6.302 authority attached. The door was never open. - 130 rows (28.9%), $24.69B are coded full and open, full and open after exclusion of sources, or competed under SAP. The door was open and exactly one company walked through it.
Those are opposite facts about your pipeline wearing the same number, and the board-wide ratio is flattered by hardware. Split the live rows on PSC and the services half behaves differently: 206 of 526 services rows with a recorded offers count drew a single bid (39.2%), and inside those 206 the causes run near even, 99 competed against 107 never competed. On the supplies side it is 244 of 341, 71.6%, and almost none of it was ever contestable.
So the useful screen is not the offers count. It is the offers count crossed with the competition code.
Your Component Average Is a Portfolio Artifact
Run the single-bid share by component and you get Navy 61.0%, Air Force 56.1%, Army 34.3%, which reads like three procurement cultures.
Run it by contracting office and the component dissolves. Inside Army Contracting Command alone, Redstone Arsenal's services rows are single-bid 21 of 35 (60.0%) while Rock Island's are 3 of 15 (20.0%), and those two offices answer to the same command.
The split by cause is sharper still (chart below).
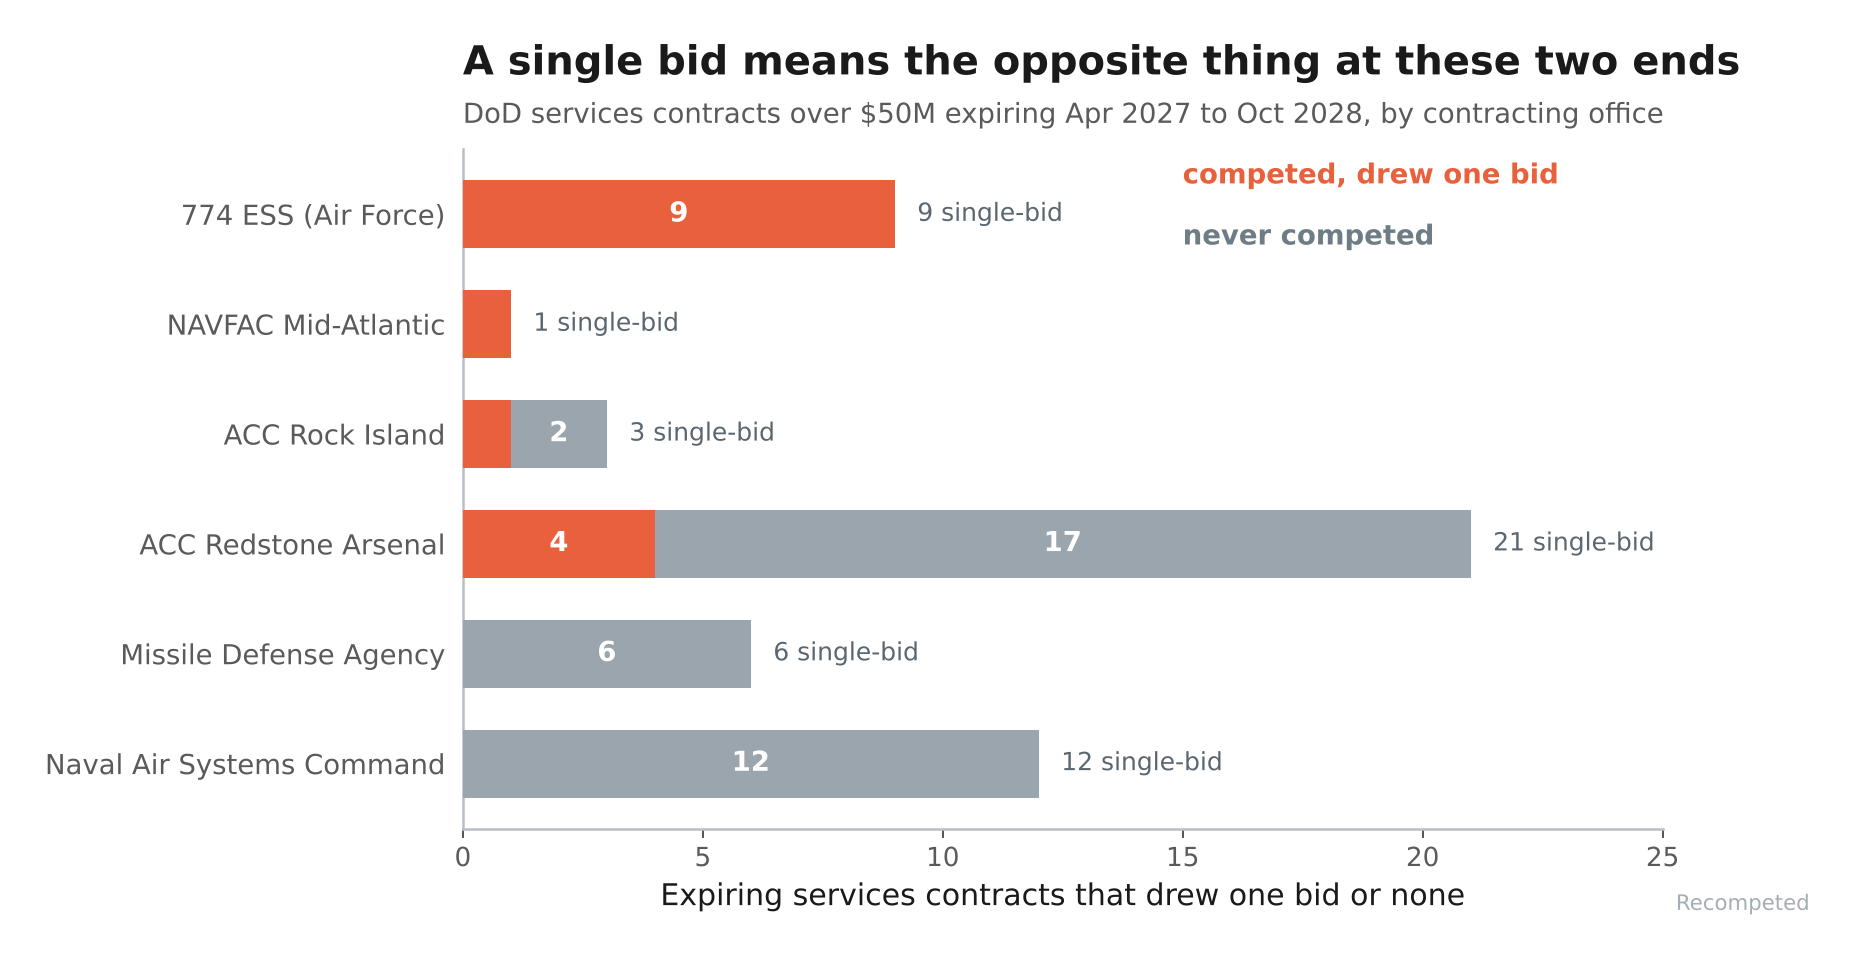
774 ESS reached nine single-bid services awards by competing all nine of them. NAVAIR reached twelve by competing none. Both offices would report the same single-bid rate to anyone asking at the component level, and a capture team reading that rate would draw exactly the wrong conclusion at one of them.
Okay, so what does the open-door set actually look like.

The rest of this brief is for subscribers.
The specific solicitations, dockets, and dates to act on sit past this line.
$50 a month, or $500 a year.
Already a subscriber? Sign in