 Recompeted
131 Services RFPs in 22 Days
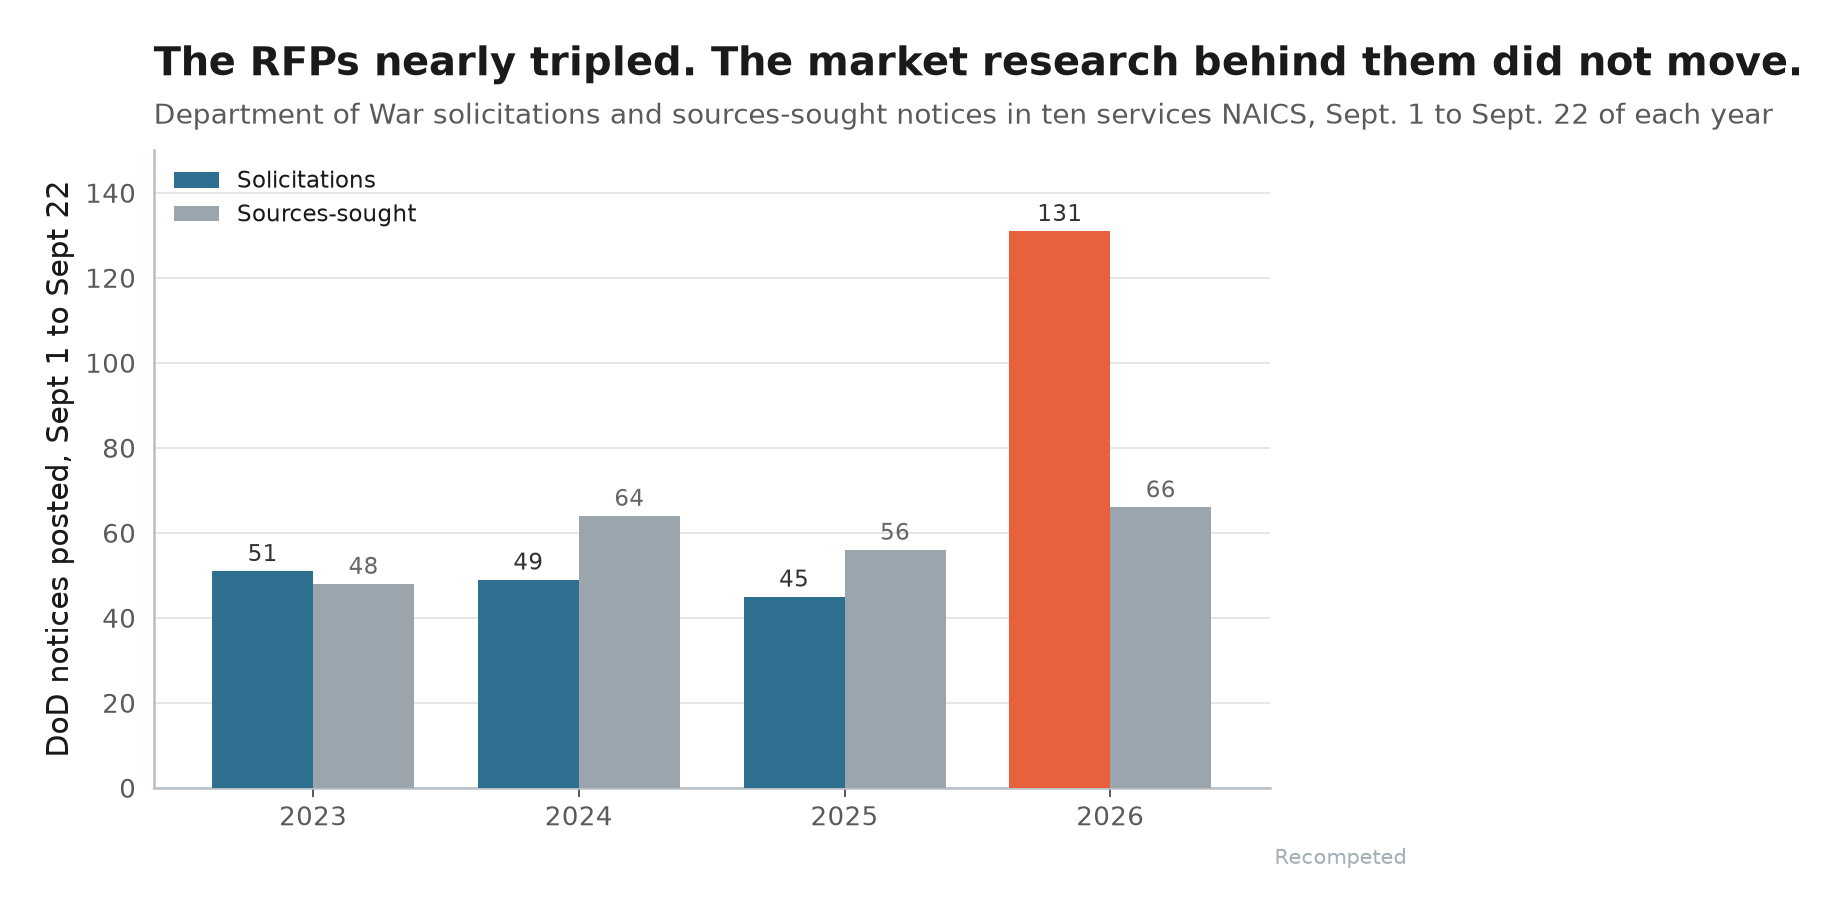
Between September 1 and this morning the Department of War posted 131 solicitations in the ten services codes we track. The identical window produced 51, 49 and 45 in the three prior years. Sources-sought notices, the thing you watch to see a recompete coming, did not move at all.
If you run a services capture pipeline, the last three weeks put more on your desk than any stretch this year. The record says that is not your imagination.
Between September 1 and this morning, the Department of War posted 131 solicitations in the ten services NAICS this desk tracks: engineering services, facilities support, R&D support, computer systems design, the codes where capture and BD headcount actually sits.
The same 22-day window last year produced 45.
"Is September always like this?"
No. And that is the whole finding.
Four Septembers, One Outlier
We pulled the identical September 1 to September 22 window out of SAM for each of the last four years. Same department node, same ten codes, same notice type.
The prior three years ran 51, 49 and 45 solicitations (chart below). This year ran 131, roughly 2.7x the three-year average and 2.9x last September.
The spike is broad. The busiest single contracting office in the run, NAVSUP Fleet Logistics Center Norfolk, accounts for 13 of the 131.
No single code carries it either: 541330 engineering services leads at 46, facilities support at 23, R&D support at 21. And no single day dumped a queue, the flow ran steady across the month and peaked at 16 notices on September 17.
Worth saying plainly: the count is notices, and a good share of the 131 are Q-numbered commercial RFQs that will never appear in anyone's five-year plan.
The bid-decision load is real all the same, because someone on your team has to open each one and say no.
The Series That Didn't Move
Now the part that should bother you.
Sources-sought notices in the same codes over the same window: 48 in 2023, 64 in 2024, 56 in 2025, 66 this year. Flat, while the solicitation count nearly tripled.
That breaks a ratio which had held all year. Every one of the first eleven months of FY26 produced more sources-sought than solicitations, usually by a wide margin, and April ran 138 of them against 70 solicitations.
September ran 131 solicitations against 66. About two RFPs for every piece of market research.
Whatever pushed these buys out the door, it did not route through a fresh round of market research in the same month.
What That Does to Your October
Two readings fit the record, and the record does not yet settle which one is right:
- The market research already happened, back in the spring, and what you are watching is a queue draining before the fiscal year closes. October is then quiet, and the pipeline you built off March and April is intact.
- The requirements went straight to solicitation. Your early-warning file has a hole in it, and the next wave arrives the same way.
Either reading argues for the same move this week. Go back through the sources-sought you logged in March and April, when they were landing at 138 a month, and check which of them just surfaced as an RFP under a number you were not watching.
Search on the scope, not the number. We tested the match across all of FY26: of 1,149 distinct services sources-sought numbers, only 31 ever reappear on a later solicitation under that same number.
Agencies renumber between the market research and the buy, so a tracker keyed to the sources-sought number quietly never fires.
Final Thoughts
One September does not make a trend, and we would not call it one yet. The prior three years sat within six notices of each other, which is about as stable as a baseline gets in this market, and this year cleared it by a factor of nearly three.
The useful part is that the two series came apart. For years the way to see a services recompete coming was to watch what an agency asked about before it asked for a price.
That still works for the requirements that came through in the spring. It did very little for the last three weeks.
Thanks for reading.