 Recompeted
Why Your Recompetes All End on the Thirty-First
Twelve DoD contracts on our expiring board end on February 28, 2028. Eleven end on February 29. That one-day split is the tell for a pattern that decides when half your pipeline actually comes up.
Twelve contracts on our expiring board end on February 28, 2028.
Eleven end on February 29.
2028 is a leap year, so only the second group lands on the actual end of the month. The other twelve stop one day short of it, and between them those two dates hold 23 of the 50 contracts the board carries in the whole of February 2028, spread across eighteen distinct end dates.
Something is pulling contract end dates toward the end of the month. We went and measured how hard.
Two days out of thirty-one
We refreshed the expiration pipeline this morning: 1,203 DoD prime contracts over $50M with a period of performance ending between 2027-02-19 and 2028-08-10, carrying $421.18B in obligations.
Those 1,203 contracts end on 335 different calendar dates. In theory that is a nicely spread problem.
In practice, 549 of them, 45.6% of the board, come off on the 30th or the 31st (chart below).
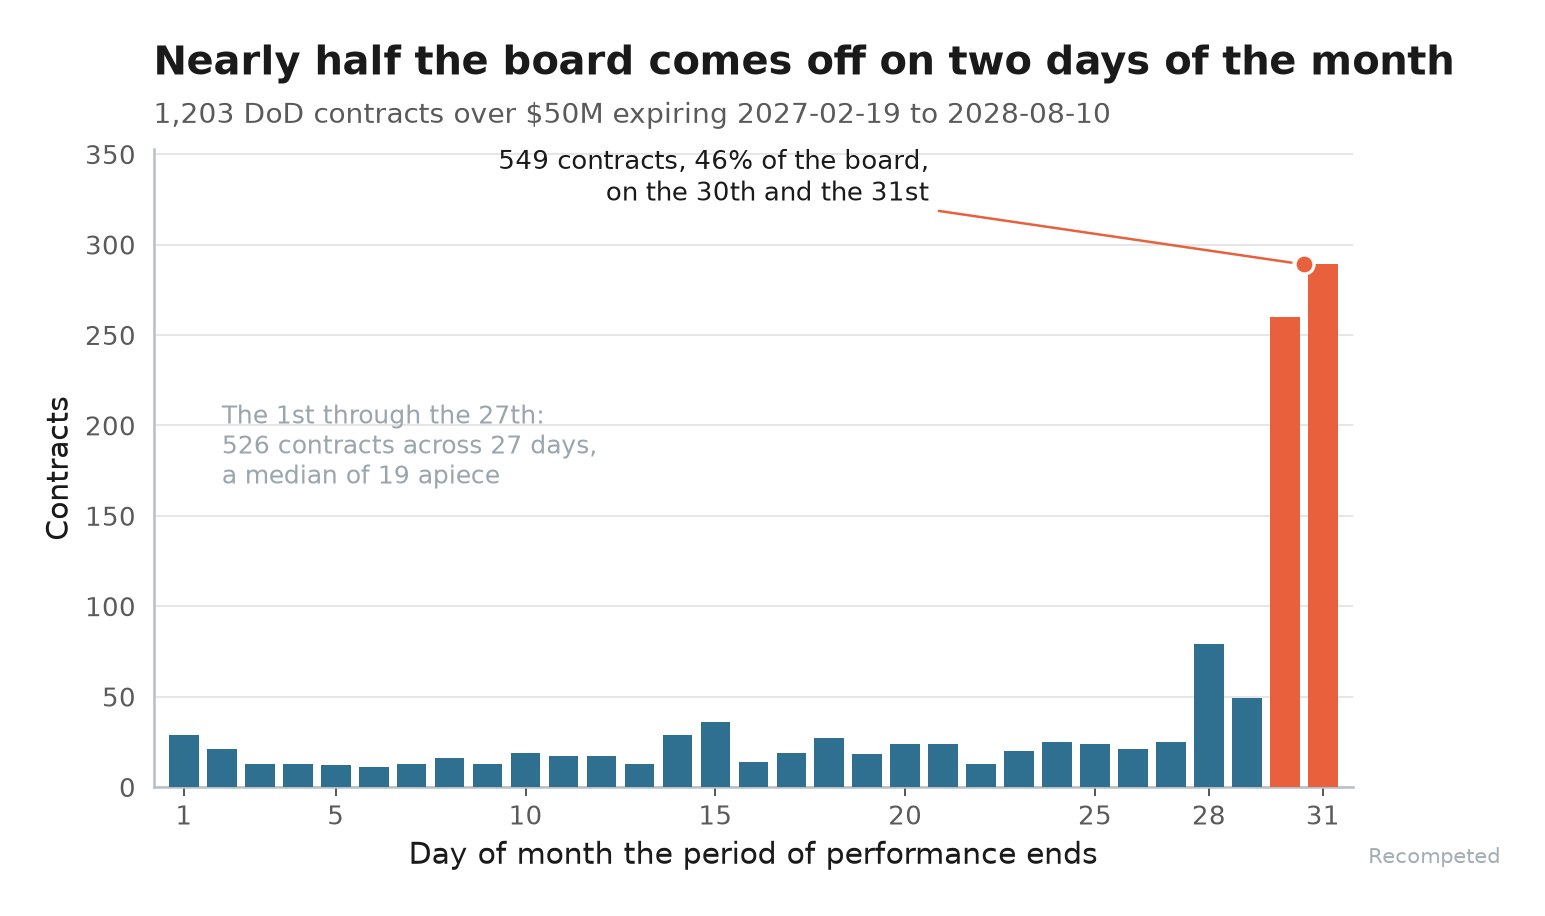
Widen it to the true last calendar day of each month, which is what the February split above is really about, and you get 555 rows, 46.1% of the board, and 59.2% of the dollars. Nearly six in ten obligated dollars on the expiring board come off contract on one day a month.
The rest of the calendar is flat. The 1st through the 27th hold 526 contracts across 27 days, a median of 19 apiece.
Twenty-five dates out of 335 hold half the board.
So the tracking problem is smaller than it looks. Half your forward book resolves onto about two dozen dates, and 282 contracts, $120.99B, land specifically on a fiscal quarter end.
The single busiest date is September 30, 2027: 73 contracts, $33.44B. Navy 26, Army 19, Air Force 16, then DLA and MDA at four each, DCMA at three, WHS at one.
Our window contains exactly one September 30, so treat that as the size of one FY boundary rather than a trend across years.
Where it gets interesting
The obvious read is that services contracts drive this. Option years run in twelve-month blocks, so services work should stack on clean month boundaries harder than anything else.
We tested it. The opposite is true.
Split the board on PSC and the products and equipment side is the clustered one:
- Products: 528 rows, 59.8% ending on the 30th or 31st. Half of that segment resolves onto 13 dates. Across the 1st through the 27th it runs a median of 5 contracts a day.
- Services: 675 rows, 34.5% ending on the 30th or 31st. Half of that segment takes 42 dates. Across the 1st through the 27th it runs a median of 13 a day.
Hardware clusters on those two days at 1.7 times the services rate, and it takes a third as many dates to cover half of it. And the services board is scattered across 276 distinct end dates, which is most of the calendar.
We are not going to tell you why a contracting officer picks one date over another, because this dataset measures where the dates land and not what was in the file when they were set. What we will say is that the pattern is administrative rather than operational, which is a bit of an oversimplification for time.
What that costs you
If you sell services, there is no recompete season to plan against. Your dates are idiosyncratic, they arrive two or three at a time, and the only way to hold them is one at a time.
We wrote up the five LOGCAP V performance task orders on Friday and they are exactly this shape. KBR's two biggest come off on March 29 and March 11, 2027, eighteen days apart and both mid-month.
The reverse holds for the hardware side. Thirteen dates cover half of it, and a program office staring at a same-day stack has to sequence the work somehow.
Whether that sequencing actually produces more bridges is a real question and we have not measured it, so we are not going to claim it.
One more thing worth carrying into your own tracker. These are current end dates, and current end dates move.
Our own sweep-diff five days ago found 33 of 1,229 observed contracts had shifted their end date across fifteen sweeps, a median of 59 days each. A date that sits on a clean month end today is a date somebody chose, and it can be rechosen.
Final Thoughts
None of this changes which contracts are expiring. It changes how you look at the list.
A 335-date problem is a monitoring chore. A 25-date problem is a calendar you can put on a wall, and once it is on the wall the September 30 stack stops being a surprise and starts being a staffing decision you make in the spring.
The catch is that the compression works against the people it should help most. Services work, the part of the board with the most capture headcount pointed at it, is the part the calendar refuses to organize.
Thanks for reading.